Home / Weather
Cold enough for the snow guns?
Snow Trails on where its snow comes from: We rely more on snowmaking machines to provide consistent coverage.
(snowtrails.com, read November 11, 2026) This page shows how the forecast at each Ohio hill compares with the temperature and humidity Snow Trails says it looks for. It can’t tell you whether anyone turned the guns on.
No snow report here. We don’t know what any hill is doing today, and nothing on this page tells you whether to drive. Hours, lifts, lanes and snow are the operator’s to report: follow the link to its own page first. Why we work this way.
What temperature does a hill need?
We found one Ohio operator that publishes its figure. Snow Trails:
“We look for a Wet Bulb Temperature, which is a calculation of ambient temperature around 29 degrees Fahrenheit or below and relative humidity of 60% or below, to produce Snow Trails Quality Snow Standard we hold ourselves to and one many have come to expect.”
On planning: Snowmaking plans are based on forecasted temperatures in the upper twenties and evaluated on how long they will hold there or below each night.
(snowtrails.com, read November 11, 2026) On temperature and humidity: It is all about ambient temperature and relative humidity and how they will change within a given ten day forecast.
(snowtrails.com, read November 11, 2026)
That sentence about wet-bulb can be read two ways: a wet-bulb temperature of about 29°F or lower, or an air temperature of about 29°F or lower together with humidity of 60% or lower. The panels count the first and give the second beside it, so you can see both.
Snow Trails’ own figures at three temperatures:
In 12 hours @ 28 degrees F we can cover over 6 acres with 1" of snow
(snowtrails.com, read November 11, 2026)In 12 hours @ 26 degrees F we can cover over 13 acres with 1" of snow
(snowtrails.com, read November 11, 2026)In 12 hours @ 24 degrees F we can cover over 18 acres with 1" of snow
(snowtrails.com, read November 11, 2026)
The other three hills print no figure on the pages we read, so the 29°F line on their panels is Snow Trails’ number applied to their weather. It is a yardstick, not their rule. What they do print is a description of their equipment. These lines describe equipment, not the state of any hill today: Mad River Mountain, With 100+ guns, the largest snowmaking system in the state ensures 100% coverage.
(skimadriver.com, read November 11, 2026) Boston Mills Brandywine, Dozens of snowguns line the trails at BMBW, offering complete snow coverage.
(bmbw.com, read November 11, 2026) Alpine Valley, Alpine Valley features 100% snowmaking coverage with dozens of snow guns!
(alpinevalleyohio.com, read November 11, 2026)
What does the forecast say at each hill?
Snow Trails: wet-bulb forecast
The National Weather Service’s hourly forecast for Snow Trails’ address near Mansfield (forecast grid CLE/59,25), worked into a wet-bulb temperature for each hour.
The numbers load here from the National Weather Service when JavaScript is on.
Weather only. This panel reads a forecast and can’t see a hill, so it never tells you what is on the ground or whether lifts are turning. The figure it counts against is Snow Trails’ own, and each operator decides for itself. How the numbers are worked out · Where the figure comes from
Mad River Mountain: wet-bulb forecast
The National Weather Service’s hourly forecast for Mad River Mountain near Zanesfield (forecast grid ILN/60,95), worked into a wet-bulb temperature for each hour.
The numbers load here from the National Weather Service when JavaScript is on.
Weather only. This panel reads a forecast and can’t see a hill, so it never tells you what is on the ground or whether lifts are turning. The figure it counts against is Snow Trails’ own, and each operator decides for itself. How the numbers are worked out · Where the figure comes from
Boston Mills and Brandywine: wet-bulb forecast
The National Weather Service’s hourly forecast for the Boston Mills address in Peninsula (Brandywine is about two miles north) (forecast grid CLE/89,55), worked into a wet-bulb temperature for each hour.
The numbers load here from the National Weather Service when JavaScript is on.
- Boston Mills and Brandywine: the operator’s own snow report
- National Weather Service forecast for this point
Weather only. This panel reads a forecast and can’t see a hill, so it never tells you what is on the ground or whether lifts are turning. The figure it counts against is Snow Trails’ own, and each operator decides for itself. How the numbers are worked out · Where the figure comes from
Alpine Valley: wet-bulb forecast
The National Weather Service’s hourly forecast for Alpine Valley’s address in Chesterland (forecast grid CLE/98,68), worked into a wet-bulb temperature for each hour.
The numbers load here from the National Weather Service when JavaScript is on.
Weather only. This panel reads a forecast and can’t see a hill, so it never tells you what is on the ground or whether lifts are turning. The figure it counts against is Snow Trails’ own, and each operator decides for itself. How the numbers are worked out · Where the figure comes from
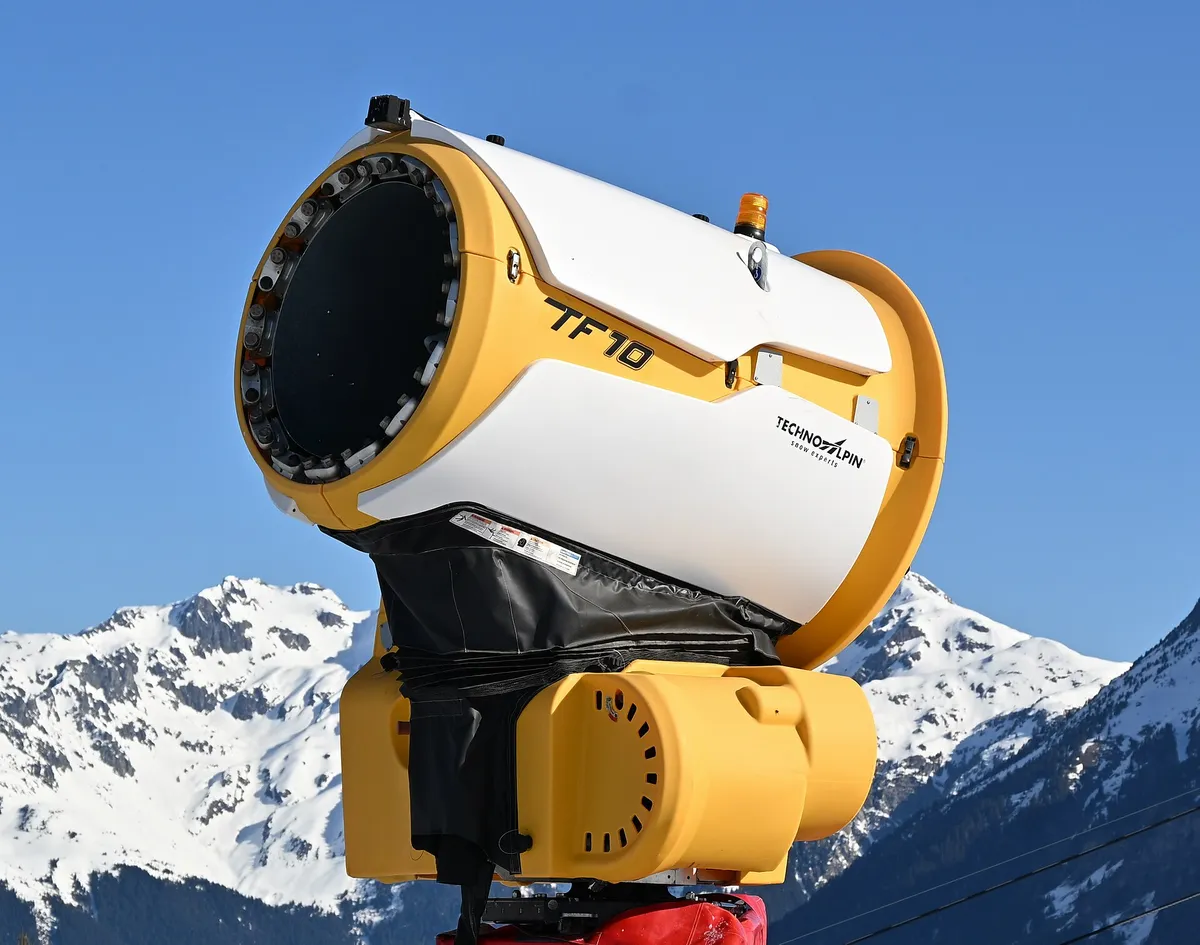
TechnoAlpin TF10 snow cannon, Villard-Reculas, 2026Photo: DimiTalen, CC0, via Wikimedia Commons; cropped and resized. Villard-Reculas in the French Alps, not Ohio, on April 5, 2026. It shows the kind of machine, not any Ohio hill’s equipment.

How are the numbers worked out?
Your browser asks the National Weather Service for the hourly forecast of the grid square that holds each hill’s point. The Weather Service on its data: All of the information presented via the API is intended to be open data, free to use for any purpose.
(weather.gov, read November 11, 2026) Each forecast hour comes with an air temperature and a relative humidity. From those two, and a pressure, the page works out a wet-bulb temperature: the temperature a wet surface cools to as water evaporates from it, which is lower than the air temperature whenever the air is dry.
The method is the one behind the National Weather Service El Paso office’s online calculator. Its write-up says: The best way to do this is by using a Skew-T diagram which is used by the National Weather Service and other meteorologists for determining the current state of the atmosphere.
(weather.gov (PDF), read November 11, 2026) For the Weather Calculator, a process of error checking is used to give an approximate wet-bulb temperatures.
(weather.gov (PDF), read November 11, 2026) The calculator’s page script holds the two formulas, a saturation vapor pressure and a balance between it and the air’s actual vapor pressure, and our code solves the same pair:
“Ewguess = 6.112 * Math.exp((17.67 * Twguess) / (Twguess + 243.5));”
“Eguess = Ewguess - MBpressure * (Ctemp - Twguess) * 0.00066 * (1 + (0.00115 * Twguess));”
The hourly forecast carries no air pressure. We use the standard-atmosphere pressure for the forecast grid’s elevation, and the panel prints the figure it used. Real pressure moves with the weather. Our tests cover air temperatures from 5 to 40°F, humidity from 25 to 100 percent and starting pressures from 950 to 995 millibars. Within that range, a pressure 30 millibars higher or lower moves the result by less than half a degree Fahrenheit. Outside it we haven’t measured the effect.
The feed also has a field called wet bulb globe temperature. That is a heat-stress index for hot weather, not this, and we don’t use it.
What the panel will and won’t do
- It counts forecast hours over 72 hours from the top of the current hour, by night and by day.
- It drops any hour that lacks a temperature or a humidity, says how many hours it could use, and leaves a break in the chart’s line where an hour is missing. It doesn’t fill gaps.
- If the forecast is more than 30 hours old, or the request fails, it shows a failure message and no numbers. It tests that again every minute while the page is on your screen.
- It never reports what a hill is doing. For that there is the operator’s own report, linked from each panel.
Which points and grids are used?
| Hill | Latitude | Longitude | Forecast grid | Point comes from |
|---|---|---|---|---|
| Snow Trails | 40.6756 | -82.5007 | CLE/59,25 | U.S. Census Bureau geocoder, for the address the operator prints |
| Mad River Mountain | 40.3163 | -83.6806 | ILN/60,95 | Wikidata item Q14716653 |
| Boston Mills and Brandywine | 41.2633 | -81.5626 | CLE/89,55 | U.S. Census Bureau geocoder, for the address the operator prints |
| Alpine Valley | 41.5258 | -81.2602 | CLE/98,68 | U.S. Census Bureau geocoder, for the address the operator prints |
Boston Mills and Brandywine share one panel, read at the Boston Mills address.
What about natural snow?
Snow Trails on natural snowfall and on machine-made snow: Average Annual Snowfall: 52 inches
(snowtrails.com, read November 11, 2026). Though the snow is machine made, there is nothing fake about it
(snowtrails.com, read November 11, 2026). We don’t show how much snow has fallen or lies on any hill. The operator’s report is the place for that.